Poster for QCMC
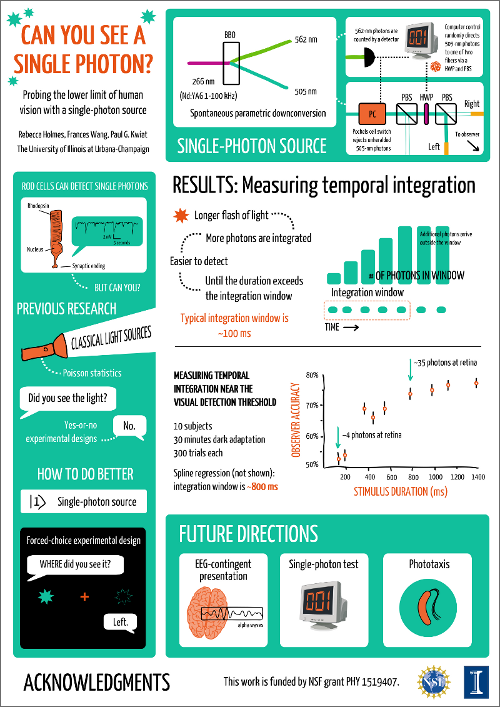
July 25, 2016I made this poster for the 2016 QCMC meeting in Singapore earlier this month. It summarizes our research using quantum states of light to study the human visual system, and focuses on a study we did to learn about how the eye adds up signals from multiple photons. Click the image to see the full version.
I wanted to try something different from the last poster I made, using no full sentences and focusing on data and diagrams that would be difficult to describe in words. I don’t have much of an attention span for reading posters and I doubt most people do either… and what’s the point when the researcher is standing right there?
Inspiration
I was inspired by this poster from Michael Barton at Bioinformatics Zen. It’s creative and different but still seriously scientific. I especially like the hand-drawn figures and the bar chart–they remind me of a lab notebook instead of a PowerPoint slide.
My experiment uses blue-green photons, because the rod photoreceptors are most sensitive to this wavelength. I decided to make that the primary color, and I chose an orange accent with the help of color-hex. The colors gave it a retro look, so I tried to go with that.
Creating the poster
I used Inkscape, a free, open-source vector graphics program. I normally use PowerPoint like any other rube, so it took some getting used to.
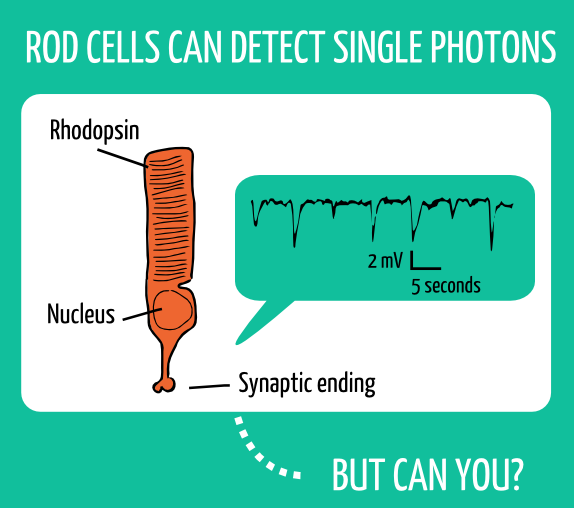
I drew the photoreceptor cell and some of the other diagrams directly in Inkscape with a tablet. For others I used the preset shape tools, or found some free vector clipart online and then edited it. To create a plot that would look hand-drawn but still accurately display data, I first imported this plot that I made with Python into my Inkscape project:
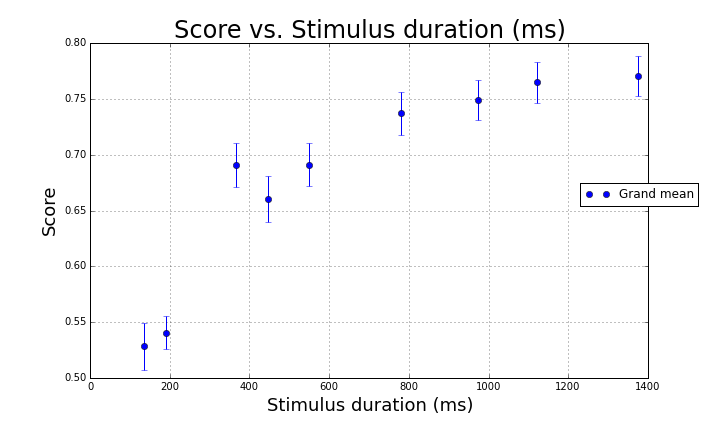
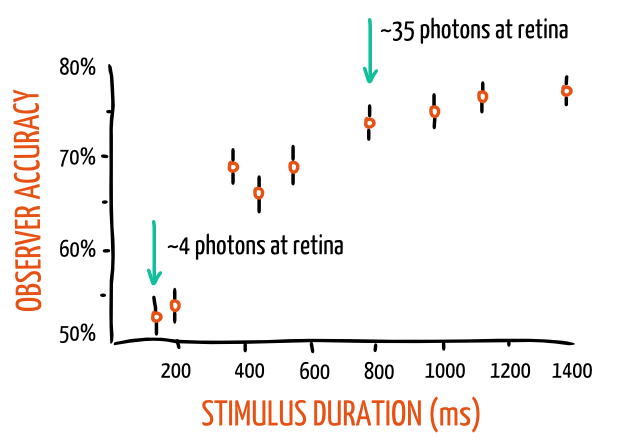
Then I carefully traced over the axes, data points, and error bars on a new layer using a tablet. I deleted the underlying plot and was left with this:
Another option is to import an image of some data and convert it directly to vector graphics. That’s what I did to get the voltage trace coming from the rod cell–first I imported an image of actual data, converted it to a path, and then trimmed and simplified it until it looked good.
Conclusions
I was happy with the poster, but also nervous about presenting it. I want to come across as a knowledgeable senior grad student at conferences, and I knew that wouldn’t be a problem once I started talking, but I was worried this could look a little too “middle school science fair” at first glance. My advisor also wasn’t crazy about it at first, and I did take some of his suggestions to add a more detailed diagram of my single-photon source at the top of the poster.
In the end, the poster session went well and I got a lot of kind words. The session was held in an open-air lobby in the Singapore heat and humidity, and even my advisor remarked that it was so hot he appreciated there not being many words to read. So, at least in a tropical rainforest, I’ll call it a success.